どーもご無沙汰しております、Keita_Nakamori(´・ω・`)です。
先日、パーティクルセンサーが届きましたので、使ってみようと思います。
Particle Sensor Model PPD42NS
ヒーターで空気を温めて上昇気流を作り、光学式センサーを通過させることによって、粒子数をカウントするとのことです。なので、向きが大事です。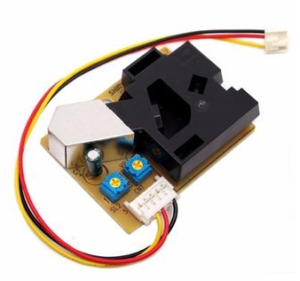
スペック
スペック的にPM2.5なんてのも取れそうです。
安定するまでに1分間必要と書いてあるので、スクリプトの中で”現在立ち上げ中です。”とか”カウントダウン”とかを入れてあげると良いと思います。
- 検出可能な粒子サイズ: 1μm (minimum.)
- 検出濃度範囲: 0~28,000 pcs/L (0~8,000pcs/0.01 CF=283mL)
- 供給電圧: DC5V ±10% (CN1コネクタ:ピン1=GND , ピン3=+5V)
- 作動温度範囲: 0~45°C
- 作動湿度範囲: 相対湿度95% 以下 (結露なきこと)
- 電力消費: 90mA
- 周囲温度: -30~60°C
- 安定するまでの立上時間:1分
- 電源ONから安定に必要な時間:1分
- 寸法: 59(W) × 45(H) × 22(D) [mm]
- 出力方式:負論理、デジタル出力 ← ここは後で解説します。
- Hi : 4.0V以上 Low : 0.7V以下
コネクタ
右から 黒 赤 黄 のケーブルがついた脱着可能なコネクタがついていました
しかし、これ、ブレッドボードに刺さるわけでも、ブレッドボード用のケーブルがささるわけでもないので、取っ払ってしまいました。
コネクタケーブルを引き抜くと、ちょうどラズパイのGPIOと同じサイズのピンが出てきますので黒 赤 黄の3本のメス型ケーブルに差し替えました。
説明書によると 右から
CN : S5B-EH(JST)
1 : COMMON(GND)
2 : OUTPUT(P2)
3 : INPUT(5VDC 90mA)
4 : OUTPUT(P1)
5 : INPUT(T1)・・・FOR THRESHOLD FOR [P2]
となっていますので、使用するのは、黒:GND 赤:5V 黄:出力P1 の3つになります。
ラズパイ側のGPIO
事前に必要な知識として、ラズパイGPIOピンの指定方法には2種類の表現があります。
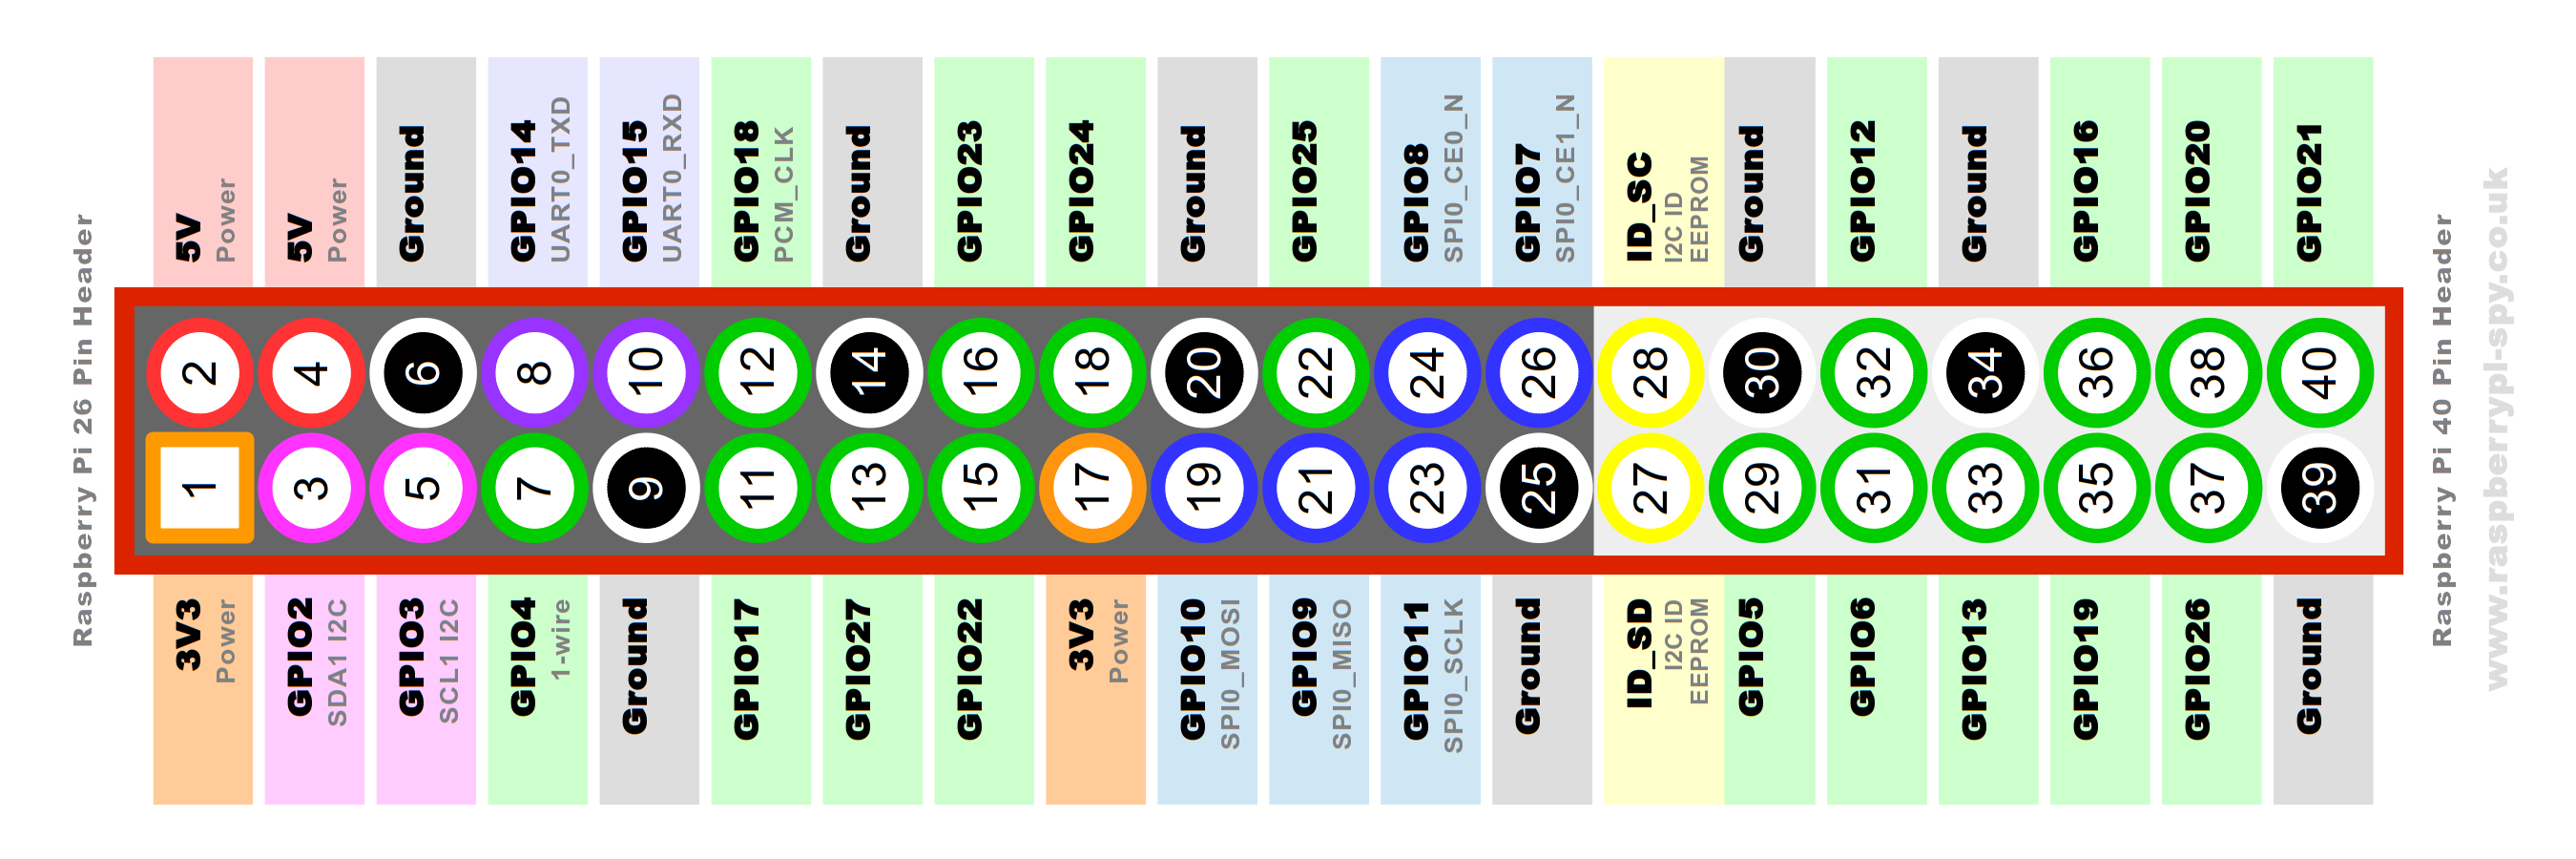
1.BOARD番号で指定する場合
PythonではGPIO.setmode(GPIO.BOARD)と書きます。
ラズパイのボード(基盤)の配置順に番号が振られていて、たとえばpin=40とした場合はGPIO21のことを指します
2.BCM番号で指定する場合
こちらはGPIO.setmode(GPIO.BCM)と書きます。
GPIO21を指定したいときは、そのままpin=21と書きます。
こちらのほうがわかりやすいので私はこちらを使っています。どっちでもOKです。
出力データと処理の話
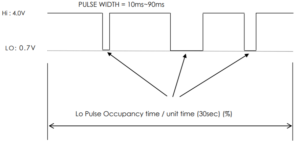
- 出力はパルスで出力されます。
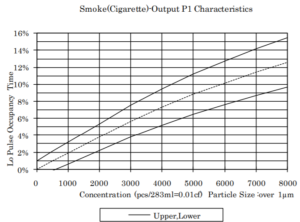
- 低パルスの状態が30秒間に占める割合(LPO:Low Plulse Occupancy time)を粒子数として換算するようです。
「1μm以上の粒子が283mLの中に何個入っているか」と「低パルス占有率」の関係を測定したサンプルデータです。(メーカーHPより)
スクリプト
では、センサーから出力されたLowパルスの占有率を算出しましょう。
まずは、うまく行かなかった例です。
1 2 3 4 5 6 7 8 9 10 11 12 13 14 15 16 17 18 19 20 21 22 23 24 25 26 27 28 29 30 31 32 33 34 35 36 37 38 39 40 41 42 43 44 45 46 47 48 49 50 51 52 53 54 55 56 57 58 59 60 61 62 63 64 65 66 67 68 69 70 71 72 73 74 75 76 77 78 79 80 81 |
# モジュールをインポート import RPi.GPIO as GPIO import time # 微小なLowパルス時間をカウントする def time_low(pin): """ args: pin :pulse input pin number variables: t_start:開始時間 t_end :終了時間 returns:Lowパルスの微小時間 t_end - t_start: (終了時間 - 開始時間) """ # 変数の初期化(現在時刻) t_start = time.time() # 変数の初期化 t_end = time.time() # GPIOに入力されるパルスがLowの時間 while GPIO.input(pin) == False: t_end = time.time() return (t_end - t_start) # Lowパルス占有率を計算する def lpo(pin): # 初期の時間の定義 t0 = time.time() # low時間の初期化 t_low = 0 # サンプリング時間=30sec (スペックより) ts = 30 # ループします。 while(True): # LOW状態の微小時間dt_lowを求める関数:time_low() dt_low = time_low(pin) # low時間に追加する t_low = t_low + dt_low # (現在時間-初期時間) が サンプリング時間を超えたらブレイク if ((time.time() - t0) > ts): # LOWパルス占有率 low_ratio = t_low/ts print("Low Pulse Time [sec]:".format(low_ratio)) print(ratio, " [%]") break # GPIO.BCMの表現でピン番号を指定する GPIO.setmode(GPIO.BCM) # センサーからのパルスが入力されるピンを指定する pulse_pin = 21 # TRIG_PINを出力, ECHO_PINを入力 GPIO.setup(pulse_pin,GPIO.IN) # 実行直後に予定な警告が出ないようにする。 GPIO.setwarnings(False) #とりあえず3回出力してみる for i in [1,2,3]: # Lowパルス占有率算出関数:lpo lpo(pulse_pin) # 使用しているピン設定をクリアにする GPIO.cleanup() |
改良
動かないので、改良ついでにクラス化してみました。
なおかつ30秒ごとに出力される粒子濃度のデータをconsentration.txtに随時書き出すようにしました。
1 2 3 4 5 6 7 8 9 10 11 12 13 14 15 16 17 18 19 20 21 22 23 24 25 26 27 28 29 30 31 32 33 34 35 36 37 38 39 40 41 42 43 44 45 46 47 48 49 50 51 52 53 54 55 56 57 58 59 60 61 62 63 64 65 66 67 68 69 70 71 72 73 74 75 76 77 78 79 80 81 82 83 84 85 86 87 88 89 90 91 92 93 94 95 96 97 98 99 100 101 102 103 104 105 106 |
#!/usr/bin/env python # -*- coding: utf-8 -*- import RPi.GPIO as GPIO import time import datetime class particle_counter(): def __init__(self): pass def set_pin_number(self, PIN=21): self.PIN = PIN GPIO.setmode(GPIO.BCM) GPIO.setup(self.PIN, GPIO.IN) GPIO.setwarnings(False) def particle_count(self, count_times=10): self.count_times = count_times #print('Counting Now') print(' datetime.datetime.now() : Pulse Low Occupancy') for i in range(self.count_times): print('Revolution : ',i) self.lpo() def lpo(self): #print('lpo method excuting') t_start = time.time() t_low = 0 t_interval = 30 # [sec] by instruction while(True): # LOW状態の微小時間dt_lowを求める関数:time_low() dt_low = self.time_low() # low時間に追加する t_low += dt_low t_current = time.time() - t_start # (現在時間-初期時間) が サンプリング時間を超えたらブレイク if (t_current > t_interval): # LOWパルス占有率 #print('(self.t_current,self.t_low)aaaaa: ', (t_current, t_low)) self.low_occupancy = t_low / t_current print(' {} ====> {:.3g}'.format(datetime.datetime.now(),self.low_occupancy)) f = open('consentration.txt','a') data=str(datetime.datetime.now())+","+str(self.low_occupancy) f.write(data+"\n") f.close() break # 微小なLowパルス時間をカウントする def time_low(self): """ args: pin :pulse input pin number variables: t_start:開始時間 t_end :終了時間 returns:Lowパルスの微小時間 t_end - t_start: (終了時間 - 開始時間) """ # 変数の初期化(現在時刻) t_start = time.time() t_end = time.time() if GPIO.input(self.PIN) == 1: return 0.0 # GPIOに入力されるパルスがLowの時間 while GPIO.input(self.PIN) == 0: t_end = time.time() return (t_end - t_start) # Excute to moniter if __name__ == '__main__': # Make instance device001 = particle_counter() # Set signal pin device001.set_pin_number(PIN=21) # Excute device001.particle_count(count_times=1000000) # Finish GPIO.cleanup() print('==== Done ====') |
出力:consentration.txt
中身は下記のような感じです。
|
|
2019-05-30 19:16:40.318976,0.07213182909293626 2019-05-30 19:17:10.434010,0.0951778309901365 2019-05-30 19:17:40.536987,0.07830632987722516 2019-05-30 19:18:10.660109,0.05319190541036891 2019-05-30 19:18:40.774304,0.030014825256954498 2019-05-30 19:19:10.876265,0.01660005851583172 2019-05-30 19:19:40.980323,0.019892370764988204 2019-05-30 19:20:11.065823,0.012348209387846658 2019-05-30 19:20:41.148922,0.01847427585179943 2019-05-30 19:21:11.243032,0.010773055171737232 |
データ処理
データを処理するためにpandasで読み込んで、整えましょう。
文字パターン抽出 ” .str.extract() ” で文字列を 年月日 時間 濃度 に切り分けます。
|
|
import numpy as np import pandas as pd with open("consentration.txt",encoding='utf-8') as f: f_list=f.readlines() # read as list series = pd.Series(f_list) df = series.str.extract('(.+) (.+),(.+)\n',expand=True,) df.columns=['ymd','hms ms','consentration'] df |
すると、こんな感じで切れました
|
ymd |
hms ms |
consentration |
| 0 |
2019-05-30 |
19:16:40.318976 |
0.07213182909293626 |
| 1 |
2019-05-30 |
19:17:10.434010 |
0.0951778309901365 |
| 2 |
2019-05-30 |
19:17:40.536987 |
0.07830632987722516 |
| 3 |
2019-05-30 |
19:18:10.660109 |
0.05319190541036891 |
| 4 |
2019-05-30 |
19:18:40.774304 |
0.030014825256954498 |
| 5 |
2019-05-30 |
19:19:10.876265 |
0.01660005851583172 |
| 6 |
2019-05-30 |
19:19:40.980323 |
0.019892370764988204 |
可視化
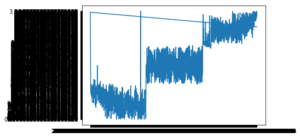
ざっくりとグラフを書いてみます。
|
|
%matplotlib inline import matplotlib.pyplot as plt x=np.array(df['ymd']+df['hms ms']) y=np.array(df['consentration']) plt.plot(x,y) plt.show() |
なんじゃこりゃ(*´﹃`*)
でもとりあえず、なんかおかしいことは分かりました。なんで階段状なんだろう。
もっと研究が必要ですね。
