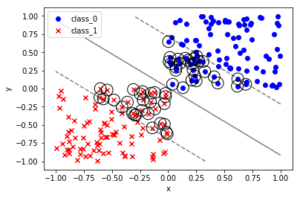
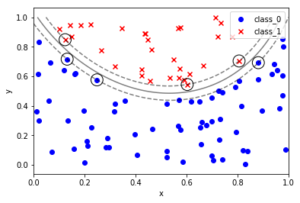
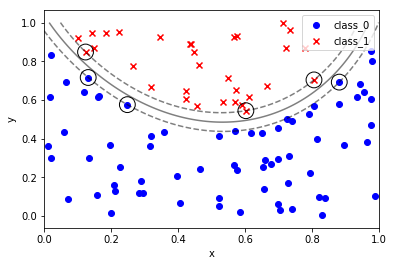
sklearnのサポートベクター分類の一般的なやり方です。
線形分類とか

カーネルに操作を加えた分類とか

スクリプト
|
1 2 3 4 5 6 7 8 9 10 11 12 13 14 15 16 17 18 19 20 21 22 23 24 25 26 27 28 29 30 31 32 33 34 35 36 37 38 39 40 41 42 43 44 45 46 47 48 49 50 51 52 53 54 55 56 57 58 59 60 61 62 63 64 65 66 67 68 69 70 71 72 73 74 75 76 77 78 79 80 81 82 83 84 85 86 87 88 89 90 91 92 93 94 95 96 97 98 99 100 101 102 103 104 105 106 107 108 109 110 111 112 113 114 115 116 117 118 119 120 121 122 123 124 125 126 127 128 129 130 131 132 133 134 135 136 137 138 139 140 141 142 143 144 145 146 147 148 149 150 151 152 153 154 155 156 157 158 159 160 161 162 163 164 165 166 167 168 169 170 171 172 173 174 175 176 177 178 179 180 181 182 183 |
#sklearn_text_for_data_science_svm """サポートベクターマシン できること:分類 回帰 外れ値検出 線形分離できないとき、データを高次元の移すのではなく、データ間の近さを定量化するカーネルを導入する カーネル:高次元空間でのデータ間の内積を計算する関数に相当する """ 'サポートベクターマシン\nできること:分類\u3000回帰\u3000外れ値検出\n線形分離できないとき、データを高次元の移すのではなく、データ間の近さを定量化するカーネルを導入する\nカーネル:高次元空間でのデータ間の内積を計算する関数に相当する\n' %matplotlib inline import numpy as np import pandas as pd import matplotlib.pyplot as plt from sklearn.datasets import load_iris from sklearn.model_selection import train_test_split # ---- sklearnのプリセットデータの取り扱い(基本形)---- #インスタンスを作成 iris = load_iris() type(iris) # sklearn.utils.Bunch iris.keys() # dict_keys(['data', 'target', 'target_names', 'DESCR', 'feature_names', 'filename']) #入力データと目標データを定義する X = iris.data y = iris.target # 訓練データと検証データに分割する X_train, X_test, y_train, y_test = train_test_split(X, y, test_size=0.3, random_state=0) # ----一般的な SVCのやり方 ---- # ランダム生成の固定 np.random.seed(0) # クラス0のクラスターとして X軸 Y軸ともに0-1のランダム値を100個ずつ生成する X0 = np.random.uniform(low=0.0, high=1.0, size=(100, 2), ) # クラス0のラベル0を100個 y0 = np.repeat(0, 100) # クラス1のクラスターとして X軸 Y軸ともに-1-0のランダム値を100個ずつ生成する X1 = np.random.uniform(low=-1.0, high=0.0, size=(100, 2)) # クラス1 のラベル1を100個 y1 = np.repeat(1, 100) # 散布図としてプロットする fig, ax = plt.subplots() ax.scatter(X0[:,0], X0[:,1], marker='o', label='class 0', color='blue') ax.scatter(X1[:,0], X1[:,1], marker='x', label='class 1', color='red') ax.set_xlabel('x') ax.set_ylabel('Y') ax.legend(loc='best') plt.show() %matplotlib inline import numpy as np import pandas as pd import matplotlib.pyplot as plt from sklearn.svm import SVC # 関数化しておく: def plot_boundary_margin_sv(X0, y0, X1, y1, kernel='linear', C=1e6, xmin=-1, xmax=1 , ymin=-1, ymax=1): """学習 決定境界 マージン SV可視化 args: X0:クラス0の座標 X0[:,0]:X座標 X0[:,1]:Y座標 y0:クラス0の正解 X1:クラス1のX座標 X1[:,0]:X座標 X1[:,1]:Y座標 y1:クラス1の正解 kernel:カーネル linear , rbf など C:マージン設定(大きい方が狭くなる) xmin:グラフ描画範囲 xmax:グラフ描画範囲 ymin:グラフ描画範囲 ymax:グラフ描画範囲 """ # SVCのインスタンスを生成する svc = SVC(kernel=kernel, C=C) # argesを代入する # 学習 svc.fit(np.vstack((X0, X1)), np.hstack((y0, y1))) #(200, 2) , (200,) スタック方向に注意 # 可視化 fig, ax = plt.subplots() # クラス0をプロット ax.scatter(X0[:, 0], X0[:, 1], marker='o', label='class_0', color='blue') # クラス1をプロット ax.scatter(X1[:, 0], X1[:, 1], marker='x', label='class_1', color='red') # 決定境界とマージンをプロット # メッシュグリッドの下準備 xx, yy =np.meshgrid(np.linspace(xmin, xmax, 100), np.linspace(ymin, ymax, 100)) xy = np.vstack([xx.ravel(), yy.ravel()]).T # np.ravel():np.flatten()よりも高速に、配列を一次元化する p = svc.decision_function(xy).reshape((100, 100)) # 等高線を定義する ax.contour(xx, yy, p, colors='k', levels=[-1, 0, 1], alpha=0.5, linestyles=['--','-','--']) # サポートベクターを黒丸でマーキングする ax.scatter(svc.support_vectors_[:,0], svc.support_vectors_[:,1], s=250,facecolors='none',edgecolors='black') # グラフを装飾する ax.set_xlabel('x') ax.set_ylabel('y') ax.legend(loc='best') plt.show() # ============================================================================= # クラス0のクラスターとして X軸 Y軸ともに0-1のランダム値を100個ずつ生成する X0 = np.random.uniform(low=0.0, high=1.0, size=(100, 2), ) # クラス0のラベル0を100個 y0 = np.repeat(0, 100) # クラス1のクラスターとして X軸 Y軸ともに-1-0のランダム値を100個ずつ生成する X1 = np.random.uniform(low=-1.0, high=0.0, size=(100, 2)) # クラス1 のラベル1を100個 y1 = np.repeat(1, 100) # 関数を実行する plot_boundary_margin_sv(X0, y0, X1, y1, kernel='linear', C=0.1) # 直線では分類できない場合 %matplotlib inline import numpy as np import pandas as pd import matplotlib.pylab as plt # サンプルデータの生成 # X,Y座標データの生成 np.random.seed(0) X = np.random.random(size=(100,2)) # 2次曲線で クラスを分類する y = (X[:,1] > 2*(X[:,0]-0.5)**2+0.5).astype(int) # 散布図を作成する fig, ax =plt.subplots() ax.scatter(X[y == False, 0], X[y == False, 1], marker='x' ,color='red', label='class_0') ax.scatter(X[y == True, 0], X[y == True, 1], marker='o' ,color='blue', label='class_1') # グラフを装飾する ax.set_xlabel('x') ax.set_ylabel('y') ax.legend(loc='best') plt.show() # X,Y座標データ X0, X1 = X[y==False,:], X[y==True,:] # 正解データ y0, y1 = y[y==False], y[y==True] # 境界マージンサポートベクター関数を使う # rbf:動径基底関数 radial basis function plot_boundary_margin_sv(X0, y0, X1, y1, kernel='rbf', C=1e3, xmin=0, ymin=0) # ---- end of script ---- |
