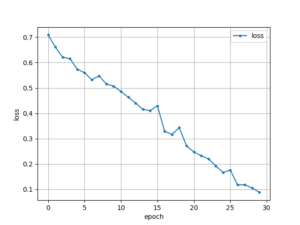
線形回帰です。
下準備
|
1 2 3 4 5 |
!python.exe -m pip install --upgrade pip !pip install --upgrade matplotlib !pip install --upgrade numpy !pip install --upgrade pandas !pip install --upgrade matplotlib |
モジュール
|
1 2 3 4 5 6 7 8 |
import torch import torch.nn as nn import torch.optim as optim import matplotlib.pyplot as plt import numpy as np %matplotlib inline plt.style.use('ggplot') |
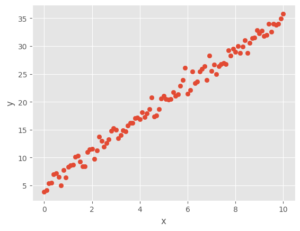
線形にノイズを乗せたサンプルデータを作成する。
|
1 2 3 4 5 6 7 8 9 10 11 12 |
# サンプルデータの生成 torch.manual_seed(0) a = 3 b = 5 x = torch.linspace(0, 10, 101)# 0 から10まで101データ作成する x = x.view(101, 1) # 101行 x 1列に変形する pytroch:batchの次元が頭にくる。そのあとに値 epsilon = torch.randn(101,1) # 101行 x 1列 ノイズデータとして pytroch:batchの次元が頭にくる。そのあとに値 y = a * x + b + epsilon plt.scatter(x, y) plt.xlabel('x') plt.ylabel('y') plt.show() |
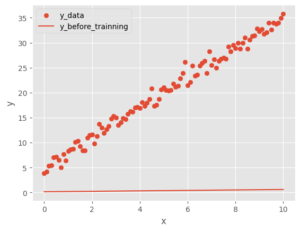
適当な一次関数を乗せる
|
1 2 3 4 5 6 7 8 9 10 11 12 13 14 15 16 17 18 19 20 21 22 23 24 25 26 27 |
class LinearRegression(nn.Module): # 継承 def __init__(self): super().__init__() # まず親クラスの初期化(継承しているため) self.linear = nn.Linear(in_features=1, out_features=1)#入力xひとつ 出力yひとつ def forward(self, x): output = self.linear(x) return output ``` ```python # 訓練前の出力を確認する plt.scatter(x.detach().numpy(), y,label='y_data') plt.xlabel('x') plt.ylabel('y') model = LinearRegression() y_before_trainning = model.forward(x) plt.plot(x.detach().numpy(), y_before_trainning.detach().numpy(), label='y_before_trainning')# detach()が必要 plt.xlabel('x') plt.ylabel('y') plt.legend() plt.show() |
あってないので学習していく
|
1 2 3 4 5 6 7 8 9 10 11 12 13 14 15 16 17 18 19 20 21 22 23 24 25 26 27 28 29 30 31 32 33 34 35 36 |
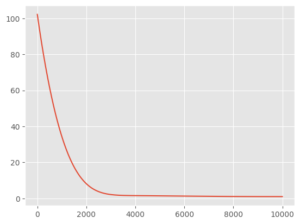
# 学習していく criterion = nn.MSELoss() # 損失関数を定義 optimizer = optim.Adam(model.parameters(), lr=0.001) # オプティマイザーを定義 学習率を定義 ``` ```python losses = [] num_epoch = 10000 for epoch in range(num_epoch): # バッチ学習とする optimizer.zero_grad() # オプティマイザーの初期化 y_pred = model(x) # xをネットワークへ入力してyを予測する loss = criterion(y_pred, y) # 予測したyと 正解データyとの損失関数を求める loss.backward() # 損失関数lossの勾配を求める optimizer.step() # オプティマイザーを使って重みパラメータを更新する # epoch 10 毎に損失を出力する if epoch % 10 == 0: print(f'epoch : {epoch} , loss : {loss}') losses.append(loss.detach().numpy()) # 損失の履歴をリストに保存する ``` epoch : 0 , loss : 102.21257019042969 epoch : 10 , loss : 101.25241088867188 epoch : 20 , loss : 100.2987289428711 epoch : 30 , loss : 99.35151672363281 epoch : 9960 , loss : 0.9862185120582581 epoch : 9970 , loss : 0.9861779808998108 epoch : 9980 , loss : 0.9861387610435486 epoch : 9990 , loss : 0.9861003160476685 plt.plot(losses) |
学習結果

|
1 2 3 4 5 6 7 8 9 10 11 12 13 14 15 16 17 |
plt.scatter(x.detach().numpy(), y,label='y_data') plt.xlabel('x') plt.ylabel('y') plt.plot(x.detach().numpy(), y_before_trainning.detach().numpy(), label='y_before_trainning')# detach()が必要 plt.xlabel('x') plt.ylabel('y') plt.plot(x.detach().numpy(), y_pred.detach().numpy(), label='y_pred')# detach()が必要 plt.xlabel('x') plt.ylabel('y') plt.legend() plt.show() ``` |
以上
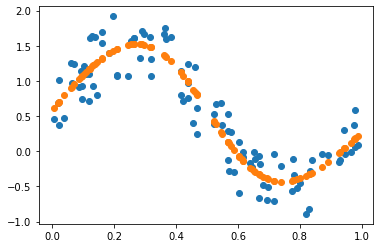
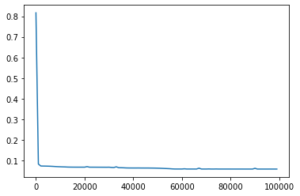
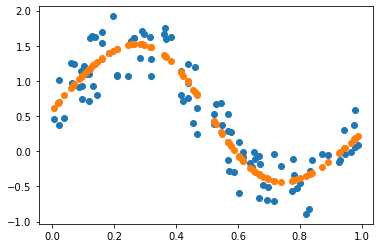
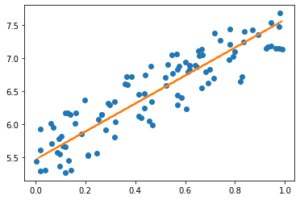
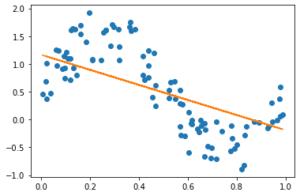
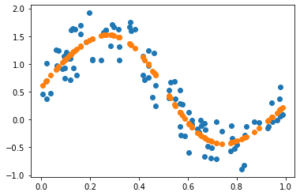
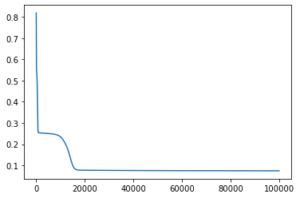

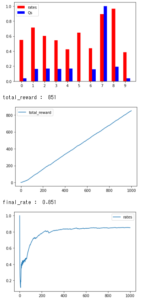


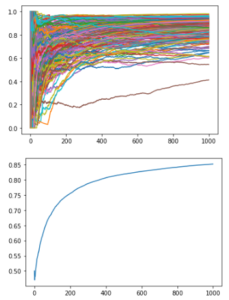



 というように、ちゃんと機能しています。


