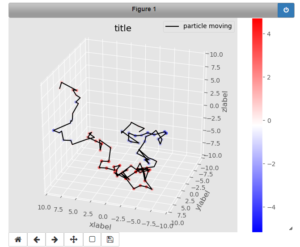
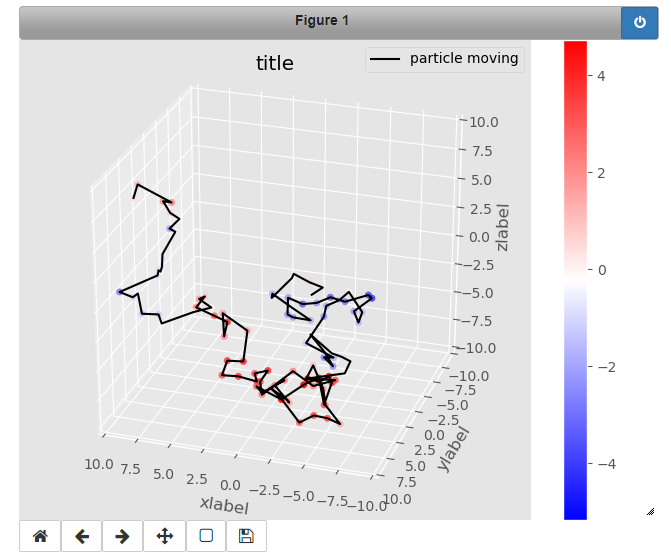
3Dプロットのやりかたです。
モジュールは
from mpl_toolkits.mplot3d import Axes3D
%matplotlib notebook
を使っていきます。

|
1 2 3 4 5 6 7 8 9 10 11 12 13 14 15 16 17 18 19 20 21 22 23 24 25 26 27 28 29 30 31 32 33 34 35 36 37 38 39 40 41 42 43 |
import numpy as np import matplotlib.pyplot as plt from mpl_toolkits.mplot3d import Axes3D %matplotlib notebook # サンプルデータ:粒子のブラウン運動を模擬 x = np.random.randn(100).cumsum() #1ステップ毎に移動していく状態を累積cumsumで表現 y = np.random.randn(100).cumsum() z = np.random.randn(100).cumsum() value = np.random.randn(100).cumsum() # ggplotのスタイルを使用する plt.style.use('ggplot') # 枠を確保 fig = plt.figure() # figを 3Dへ 変換 ax = Axes3D(fig) ax.plot(x, y, z, label='particle moving', color ='black') # カラーバー mappable = ax.scatter(x, y, z, c=value, cmap='bwr') fig.colorbar(mappable, ax=ax) # タイトル ラベルを設定 ax.set_title('title') ax.set_xlabel('xlabel') ax.set_ylabel('ylabel') ax.set_zlabel('zlabel') # 凡例を設定 ax.legend() # リミットを設定 ax.set_xlim(-10, +10) ax.set_ylim(-10, +10) ax.set_zlim(-10, +10) # グリッドを表示 ax.grid(True) plt.show() |
The following two tabs change content below.


Keita N
最新記事 by Keita N (全て見る)
- 2024/1/13 ビットコインETFの取引開始:新たな時代の幕開け - 2024年1月13日
- 2024/1/5 日本ビジネスにおける変革の必要性とその方向性 - 2024年1月6日
- 2024/1/3 アメリカ債権ETFの見通しと最新動向 - 2024年1月3日
