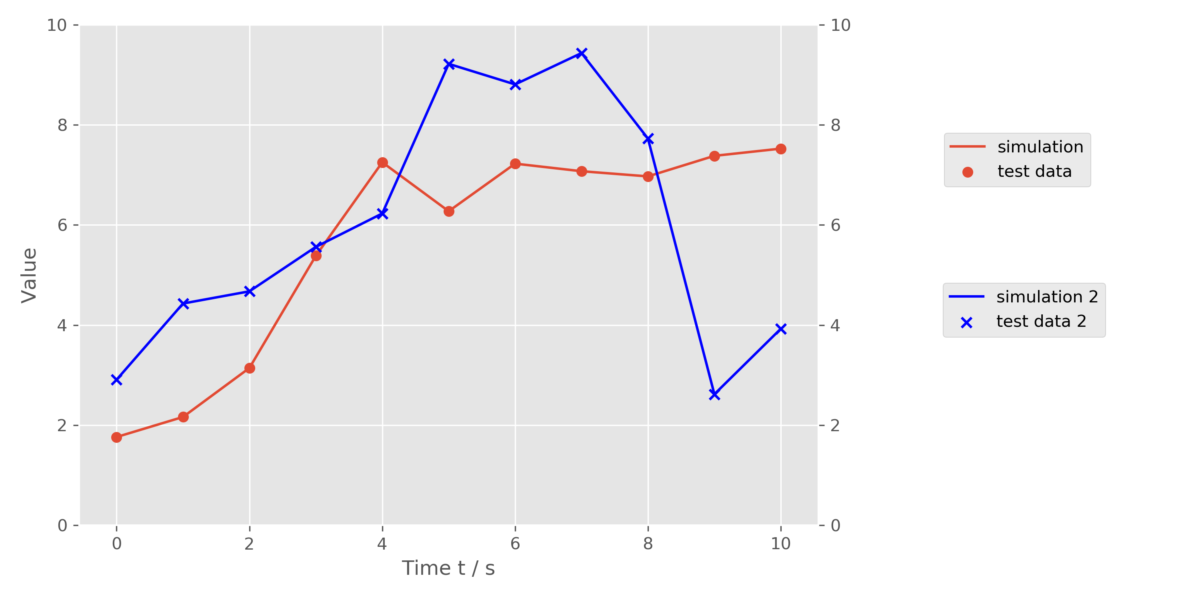
matplotlibを使って2軸あるグラフを作成してみます。

|
1 2 3 4 5 6 7 8 9 10 11 12 13 14 15 16 17 18 19 20 21 22 23 24 25 26 27 28 29 30 31 32 33 34 35 36 37 38 39 40 41 |
import numpy as np import matplotlib.pyplot as ple %matplotlib inline # サンプルデータ生成 np.random.seed(0) time = np.arange(0,11) values = np.random.randn(11).cumsum() values2 = np.random.randn(11).cumsum() * 2 #枠を確保 fig = plt.figure(figsize=(10, 5)) # サブプロットを使用する ax1 = fig.add_subplot(1,1,1) ax1.scatter(time, values, label='test data') ax1.plot(time, values, label='simulation') ax1.set_xlabel('Time t / s') ax1.set_ylabel('Value') ax1.legend(loc='best') # ここまでは同じ # 第2軸を設定する ax2 = ax1.twinx() #Timeを共通として第2軸を定義する ツインメソド ax2.scatter(time, values2, label='test data 2', color='blue', marker='x', ) ax2.plot(time, values2, label='simulation 2', color='blue') # この時点ではグリッドが2軸分重なってしまっているので修正が必要 ax1.set_ylim([0, 10]) ax2.set_ylim([0, 10]) ax2.grid(False) # 凡例がまだかぶっている ax1.legend(bbox_to_anchor=(1.38, 0.8)) ax2.legend(bbox_to_anchor=(1.40, 0.5)) # グラフを保存する plt.tight_layout() plt.savefig('data/fig_001.png', dpi=300) |


