今日は ボストンの不動産データを使って重回帰分析をしてみましょう。
Contents
一気にいきます。
データ読み込み 訓練検証データに分割 機械学習モデル定義 訓練 予測
|
1 2 3 4 5 6 7 8 9 10 11 12 13 14 15 16 17 18 19 20 21 22 23 24 25 26 27 28 29 30 31 32 33 34 35 36 |
# 重回帰分析 from sklearn.datasets import load_boston from sklearn.model_selection import train_test_split from sklearn.linear_model import LinearRegression # データ読み込み boston = load_boston() boston.keys() ''' dict_keys(['data', 'target', 'feature_names', 'DESCR', 'filename']) ''' boston['feature_names'] ''' array(['CRIM', 'ZN', 'INDUS', 'CHAS', 'NOX', 'RM', 'AGE', 'DIS', 'RAD', 'TAX', 'PTRATIO', 'B', 'LSTAT'], dtype='<U7') ''' # 訓練・検証データに分轄 X_train, X_test, y_train, y_test =train_test_split(boston.data, boston.target, test_size=0.3, random_state=0) # 数学モデルのインスタンスを作成する lr = LinearRegression() # 訓練する lr.fit(X_train, y_train) ''' LinearRegression(copy_X=True, fit_intercept=True, n_jobs=None, normalize=False) ''' # 予測する y_predicted = lr.predict(X_test) y_predicted |
相関グラフ
|
1 2 3 4 5 6 7 8 9 10 11 12 13 14 15 16 |
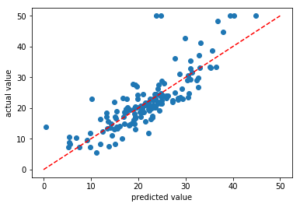
# 可視化する:正解データと予測データを比較する %matplotlib inline import matplotlib.pyplot as plt fig, ax = plt.subplots() ax.scatter(y_predicted, y_test) ax.plot((0,50), (0,50), linestyle='dashed', color='red') ax.set_xlabel('predicted value') ax.set_ylabel('actual value') plt.show() ''' 結果:正解データと予測データで 正の相関を確認できた ''' |
横軸に予測結果 縦軸に実際のデータをプロットしています。右肩上がりのまあまあな相関が取れていますが、外れ値を除いても0.5~1.5倍のばらつきがあるようです。

以上
The following two tabs change content below.


Keita N
最新記事 by Keita N (全て見る)
- 2024/1/13 ビットコインETFの取引開始:新たな時代の幕開け - 2024年1月13日
- 2024/1/5 日本ビジネスにおける変革の必要性とその方向性 - 2024年1月6日
- 2024/1/3 アメリカ債権ETFの見通しと最新動向 - 2024年1月3日
